
The Gantt chart — a century-old project-planning resource — began as a simple method for tracking task progress over time.
But in the years following its invention, we’ve since found ways to make Gantt charts multifaceted and, in turn, more efficient. Of course, there’s a trade-off: Gantt charts now contain many moving parts — making them often too complex to track with pen and paper. Fortunately, business leaders can turn to technology to do the heavy lifting.
A digital Gantt template helps project managers (PMs) quickly identify, organize, and assign tasks and make drag-and-drop changes to a project timeline. Let’s explore how to put this powerful innovation to good use.
What’s a Gantt chart template?
A Gantt chart template is a graphing tool managers populate with project data. The template allows users to plug the data into an easy-to-read visual — in this case, a stacked bar chart that tracks a task list down the y-axis and time on the x-axis.
Project managers using the Waterfall model frequently employ Gantt charts. The Waterfall method maps project phases sequentially, with each phase depending on the one before it. Gantt charts, which track tasks against time, align well with this model, as the chart helps project managers visualize task sequences.
This said, all teams, no matter what project methodology they follow, can benefit from Gantt charts. Gantt charts also accommodate non-sequential work, like concurrent project phases. And because advanced charts track dependencies, if one task’s timeline shifts, dependent ones do, too.
How does a Gantt chart template work?
Gantt charts started out as hand-drawn project mapping tools. But with contemporary technology, like automated Gantt chart templates, teams can plug in, modify, and slide data around as they wish.
Using a Gantt chart template is akin to creating a bar chart. No matter if you create one in a spreadsheet (like Excel) or project management software, you enter tasks on the y-axis and time markers, like days or months, for the x-axis — then plot. In more advanced Gantt charts, your team can assign tasks, set priorities, and establish dependencies.
Why you should use a Gantt chart template
The primary reason for using a Gantt chart template is to harness technology’s ability to quickly organize, display, and adjust data. Even a simple Gantt chart that plots tasks versus time is easier to use when project managers don’t have to make manual changes.
Here are some more advantages of easy Gantt chart templates:
They’re sharable — Gantt charts aren’t just for managers: they also benefit teams and stakeholders. When PMs use a digital template to create a Gantt chart, they can easily share a high-level view of the project, including drop-downs for task descriptions, status tags, and assignments. Sharing promotes transparency and helps mitigate error as more than one person interacts with the document.
They mitigate error — templates reduce the potential for error because a computer does the work of tracking a good deal of the data and progress. For example, an employee can change the status of a task when they finish it and rest assured that the project manager’s records will show this update. And if a PM changes the timeline of a task dependent on another, the template will adjust the projection for both tasks.
They help PMs allocate resources — gaining a high-level view of a project allows managers to allocate resources appropriately and avoid stretching time, money, and staff too thin. Preventing resource overload ensures projects stay on budget and schedule. Resource allocation is also essential to completing critical tasks: high-priority or immovable critical path activities demand resources, and supplying them allows these tasks to flow, preventing bottlenecks elsewhere in the project.
Notion: the best Gantt chart template
You could create Gantt charts from scratch in Microsoft Excel or Google Sheets — or you could save yourself the work by using a ready-made template. Notion’s free Gantt chart template offers an easy-to-read bird’s eye view of a project’s timeline and task list with plenty of additional features to streamline tracking. Plus, a team can turn any database they create on Notion into a Gantt chart (or similar project map) using the “timeline” view.
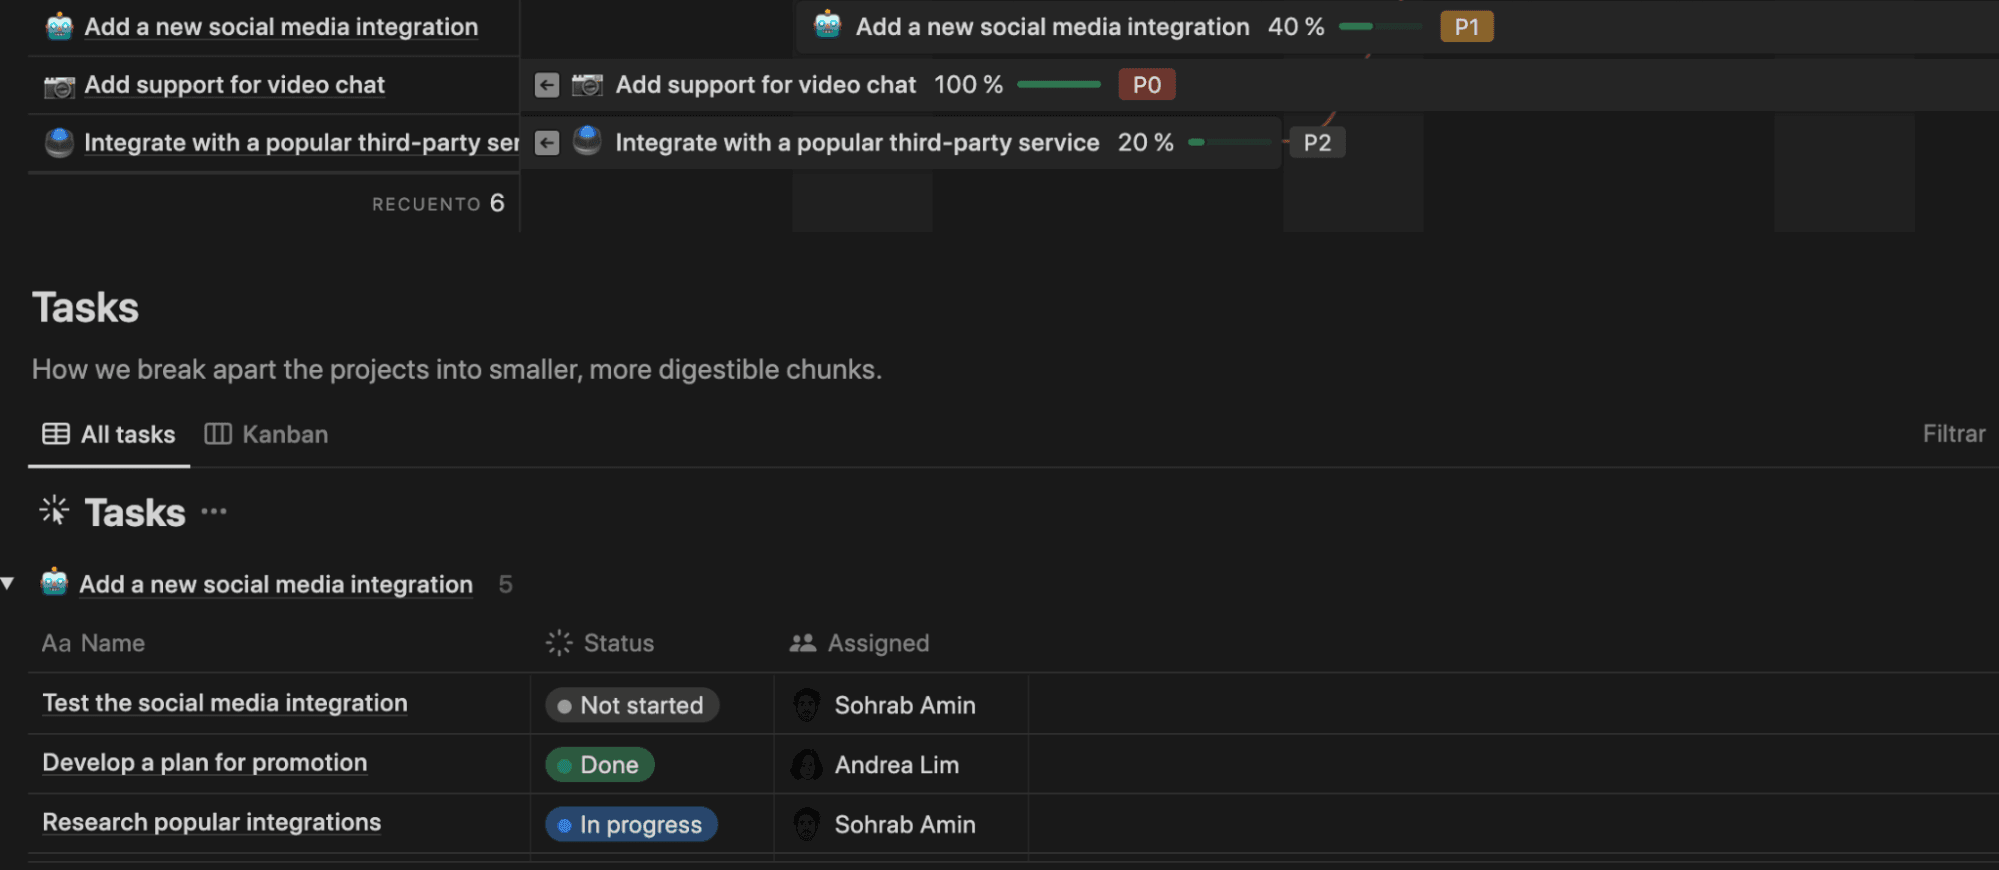
In addition to clear timeline bars for tasks and percentage complete meters, Notion’s tool includes the following:
Task groups — break down project goals into task groups: action items that are too large to be a single task but too small to be an objective. For example, in the image above, “Research popular integrations” is a task, but it feeds into a bigger category, “Add new social media integration.”
Status tabs — mark tasks as “Not started,” “Done,” or “In progress” using status tabs.
Assignments — assign tasks to team members right on the chart, so everyone involved can visualize their and others’ responsibilities.
Dependencies — link tasks that depend on one another so if one of these tasks moves on the timeline, you can quickly see the others than must move with it.
Priority level — toggle between a traditional bar graph and a priority list view, which groups tasks in a descending manner based on their level of urgency.
How to use a Gantt chart template
A Gantt chart is an excellent resource, but it’s not perfect. One of the pitfalls of this popular tool is that it implies a learning curve. Ultimately, Gantt charts promote simplicity, but PMs and other team leaders may require guidance when plotting their first chart.
Here’s a step-by-step guide to using Notion’s project plan Gantt chart template:
1. Determine the information to plot
To fill out Notion’s Gantt chart template, you’ll need to think through and assemble the following:
Task groups
Tasks
Assignees
Task start and end dates
Task priority levels
2. Insert data into the template
Once you’ve collected your data, add a “Date” property to your page. This creates the timeline on the x-axis and is the first step to building a Gantt chart. Even the sparest Gantt chart can’t function without date projections, so if you don’t have firm dates yet, estimate them.
Add new tasks to the board and give each a unique name. Then, assign the tasks to the corresponding team members.
3. Tweak the timeline view
With data on the chart, you can adjust the template to shift from the traditional timeline view to other innovative perspectives. However, if you move away from the timeline view, you will no longer be view data in the traditional Gantt chart format, which specifically plots tasks versus time. But you will get a fresh perspective on your project’s progress. For example, if you move the chart into Kanban mode, the template will replot data to accommodate this project management methodology.
Here are a few features to try:
Filters — search for precisely what you’re looking for and filter the timeline by priority, progress, status, or tasks. These viewpoints provide a new perspective, so you can quickly visualize, for example, all tasks with an “In progress” status or review which remaining action items are of the highest priority.
Project viewing styles — toggle between the timeline and priority view for the current project or a multi-project view that shows all of the teams’ in-progress initiatives.
Task viewing style — shift to Kanban mode to visualize work in this popular project management methodology’s task-board view, which organizes tasks into three status columns based on their progress tag.
4. Make adjustments as needed
All projects change. A feature requires rework, an employee gets sick, or delivery doesn’t arrive on time. As roadblocks affect your project, tweak start and end dates and reassign work. Be sure to update relevant team members and stakeholders when you make sudden or significant shifts.
Level up your project management skills with Notion
Notion’s project management platform streamlines busy work, like notetaking, and allows teams to share documents and create centralized knowledge bases efficiently. We also provide all the templates and information you need to manage your projects effectively.
Among Notion’s resources, you can find guides on how to make a comprehensive project to-do list, burn-up and burndown charts to track progress, and engineering roadmaps for cross-functional development projects.
